DES SN 5YR Tutorial Part 1: Load DES Photometry
 Dark Energy Survey Supernova Program
Tutorial Part 1 Load all Photometry Contact author: Bruno Sánchez (bsanchez@cppm.in2p3.fr)
This tutorial is intended to show how to use the dessndr python package to load some of the light-curve data from the DES SN 5YR Data Release.
We will demonstrate how to load a transient record, check its parameters and plot its photometrical light-curve.
We will load the package utils module and data module.
utils provides functionality to read the data formats
data provides with the location of the downloaded DR files.
[1]:
import warnings
warnings.filterwarnings("ignore")
[2]:
import os
[3]:
from dessndr import utils, data
This is the loacation of the cloned DR repository in our system:
[4]:
print(data.DES5YRDR_DATA_ROOT)
/Users/sanchez/Data/DES
The data module also provides with some functions to get individual files from the repo:
[5]:
data.clone_repo?
Signature:
data.clone_repo(
    repo_url='https://github.com/des-science/DES-SN5YR',
    dest_folder='/Users/sanchez/Data/DES',
)
Docstring: <no docstring>
File:      ~/Data/DES/DESSNDR/DES-SN-5YR/dessndr/data.py
Type:      function
Now we are going to load the DES photometry files:
[6]:
phot_version = os.path.join(data.DES5YRDR_DATA, '0_DATA/DES-SN5YR_DES/DES-SN5YR_DES')
We make use of the utils.PhotFITS reader class. We make an instance pointing to the photometry version we want to use (SMP nominal files or DIFFIMG).
Please check that what this reader looks for a version photometry value. This is the prefix for the files that correspond to a single photometry dataset.
[7]:
utils.PhotFITS?
Init signature: utils.PhotFITS(version)
Docstring:
Class for reading SNANA photometry tables in FITS format

Parameters
----------
- version: [str] data version name. It is the prefix to the _HEAD and _PHOT
            filenames

Attributes
----------
- dump_head: [astropy.table.Table] the header of photometry table
- dump_phot: [astropy.table.Table] the photometry table data
- head_df: [pandas.DataFrame] the header in Pandas format
- phot_df: [pandas.DataFrame] the photometry table in Pandas format
- cid_recs: [numpy.ndarray] the array of CIDs present in the data

Methods
-------
- get_lc(cid: str): [None, pandas.DataFrame] returns a lightcurve
- phot_table: -property- [pandas.DataFrame] returns the photometry df
- get_lcs(cidlist: list, tuple): [pandas.DataFrame] returns a
        data frame with the photometry for a list of cids
File:           ~/Data/DES/DESSNDR/DES-SN-5YR/dessndr/utils.py
Type:           type
Subclasses:
[8]:
phot = utils.PhotFITS(phot_version)
We can inspect some of the details of phot instance now, checking the header and photometry table.
Both are pandas DataFrame instances, related by the SNID (or more precisely Candidate ID CID)
[9]:
phot.head_df.head()
[9]:
| SNID | IAUC | FAKE | MASK_FLUXCOR_SNANA | RA | DEC | PIXSIZE | NXPIX | NYPIX | SNTYPE | ... | HOSTGAL_SB_FLUXCAL_g | HOSTGAL_SB_FLUXCAL_r | HOSTGAL_SB_FLUXCAL_i | HOSTGAL_SB_FLUXCAL_z | PEAKMJD | MJD_TRIGGER | MJD_DETECT_FIRST | MJD_DETECT_LAST | SEARCH_TYPE | PRIVATE(AGN_SCAN) | |
|---|---|---|---|---|---|---|---|---|---|---|---|---|---|---|---|---|---|---|---|---|---|
| 0 | 1642082 | UNKNOWN | 0 | 0 | 35.169212 | -5.698688 | 0.263 | 2048 | 4096 | 0 | ... | 27.120001 | 78.250000 | 109.330002 | 138.820007 | 57739.117188 | 57756.070312 | 57739.117188 | 57756.070312 | -9 | -1.0 |
| 1 | 1294480 | UNKNOWN | 0 | 0 | 34.010349 | -5.383460 | 0.263 | 2048 | 4096 | 0 | ... | 28.950001 | 138.470001 | 249.429993 | 354.040009 | 56956.085938 | -9.000000 | 56956.085938 | 57311.109375 | -9 | -1.0 |
| 2 | 1402031 | UNKNOWN | 0 | 0 | 8.426459 | -44.096779 | 0.263 | 2048 | 4096 | 0 | ... | -1.510000 | 2.420000 | 1.830000 | -1.640000 | 0.010000 | -9.000000 | 57642.109375 | -9.000000 | -9 | -1.0 |
| 3 | 1690045 | UNKNOWN | 0 | 0 | 34.245853 | -5.856924 | 0.263 | 2048 | 4096 | 0 | ... | 1.550000 | 3.490000 | 4.090000 | 5.510000 | 57773.062500 | 57763.066406 | 57756.054688 | 57781.058594 | -9 | 1.0 |
| 4 | 1905022 | UNKNOWN | 0 | 0 | 6.930402 | -42.952053 | 0.263 | 2048 | 4096 | 0 | ... | 77.339996 | 119.080002 | 142.720001 | 147.770004 | 58014.066406 | 58071.031250 | 57985.218750 | 58071.031250 | -9 | -1.0 |
5 rows × 96 columns
[10]:
len(phot.phot_df)
[10]:
1798736
We can see how many columns of metadata the header contains.
Here we can basically find a single row per event, with all the ancilliary information useful for cosmology.
[11]:
phot.head_df.columns
[11]:
Index(['SNID', 'IAUC', 'FAKE', 'MASK_FLUXCOR_SNANA', 'RA', 'DEC', 'PIXSIZE',
       'NXPIX', 'NYPIX', 'SNTYPE', 'NOBS', 'PTROBS_MIN', 'PTROBS_MAX', 'MWEBV',
       'MWEBV_ERR', 'REDSHIFT_HELIO', 'REDSHIFT_HELIO_ERR', 'REDSHIFT_FINAL',
       'REDSHIFT_FINAL_ERR', 'REDSHIFT_QUALITYFLAG', 'MASK_REDSHIFT_SOURCE',
       'VPEC', 'VPEC_ERR', 'HOSTGAL_NMATCH', 'HOSTGAL_NMATCH2',
       'HOSTGAL_OBJID', 'HOSTGAL_FLAG', 'HOSTGAL_PHOTOZ', 'HOSTGAL_PHOTOZ_ERR',
       'HOSTGAL_SPECZ', 'HOSTGAL_SPECZ_ERR', 'HOSTGAL_RA', 'HOSTGAL_DEC',
       'HOSTGAL_SNSEP', 'HOSTGAL_DDLR', 'HOSTGAL_CONFUSION', 'HOSTGAL_LOGMASS',
       'HOSTGAL_LOGMASS_ERR', 'HOSTGAL_LOGSFR', 'HOSTGAL_LOGSFR_ERR',
       'HOSTGAL_LOGsSFR', 'HOSTGAL_LOGsSFR_ERR', 'HOSTGAL_COLOR',
       'HOSTGAL_COLOR_ERR', 'HOSTGAL_ELLIPTICITY', 'HOSTGAL_OBJID2',
       'HOSTGAL_SQRADIUS', 'HOSTGAL_OBJID_UNIQUE', 'HOSTGAL_MAG_g',
       'HOSTGAL_MAG_r', 'HOSTGAL_MAG_i', 'HOSTGAL_MAG_z', 'HOSTGAL_MAGERR_g',
       'HOSTGAL_MAGERR_r', 'HOSTGAL_MAGERR_i', 'HOSTGAL_MAGERR_z',
       'HOSTGAL2_OBJID', 'HOSTGAL2_FLAG', 'HOSTGAL2_PHOTOZ',
       'HOSTGAL2_PHOTOZ_ERR', 'HOSTGAL2_SPECZ', 'HOSTGAL2_SPECZ_ERR',
       'HOSTGAL2_RA', 'HOSTGAL2_DEC', 'HOSTGAL2_SNSEP', 'HOSTGAL2_DDLR',
       'HOSTGAL2_LOGMASS', 'HOSTGAL2_LOGMASS_ERR', 'HOSTGAL2_LOGSFR',
       'HOSTGAL2_LOGSFR_ERR', 'HOSTGAL2_LOGsSFR', 'HOSTGAL2_LOGsSFR_ERR',
       'HOSTGAL2_COLOR', 'HOSTGAL2_COLOR_ERR', 'HOSTGAL2_ELLIPTICITY',
       'HOSTGAL2_OBJID2', 'HOSTGAL2_SQRADIUS', 'HOSTGAL2_OBJID_UNIQUE',
       'HOSTGAL2_MAG_g', 'HOSTGAL2_MAG_r', 'HOSTGAL2_MAG_i', 'HOSTGAL2_MAG_z',
       'HOSTGAL2_MAGERR_g', 'HOSTGAL2_MAGERR_r', 'HOSTGAL2_MAGERR_i',
       'HOSTGAL2_MAGERR_z', 'HOSTGAL_SB_FLUXCAL_g', 'HOSTGAL_SB_FLUXCAL_r',
       'HOSTGAL_SB_FLUXCAL_i', 'HOSTGAL_SB_FLUXCAL_z', 'PEAKMJD',
       'MJD_TRIGGER', 'MJD_DETECT_FIRST', 'MJD_DETECT_LAST', 'SEARCH_TYPE',
       'PRIVATE(AGN_SCAN)'],
      dtype='object')
We take for example the event 350 in our table:
We can check the CID, position and PEAKMJD:
[12]:
phot.head_df.iloc[350][['SNID', 'RA', 'DEC', 'PEAKMJD']]
[12]:
SNID            1449078
RA            53.647507
DEC          -28.908772
PEAKMJD    57686.113281
Name: 350, dtype: object
We see that the phot instance table has many rows and each one of them is indexed by the SNID.
phot can also show us the list of SNID in the files.
[13]:
len(phot.head_df)
[13]:
19706
[14]:
phot.cid_recs
[14]:
array([1642082, 1294480, 1402031, ..., 1279857, 1246351, 1255127])
We have a search utility to query the CID we are interested in:
[15]:
myCid = phot.cid_recs[350]
print(myCid)
1449078
[16]:
results = phot.query_cids(myCid)
[17]:
results[myCid]['RA']
[17]:
350    53.647507
Name: RA, dtype: float64
This returns a dictionary with keys using our chosen CID and the metadata in a nested dictionary.
It also works with lists of CIDs if needed.
We can load this particular light-curve, for inspection. In this case we make use of the method get_lc :
[18]:
phot.phot_df[(phot.phot_df.MJD==57623.401) & (phot.phot_df.CCDNUM==20)]
[18]:
| MJD | BAND | CCDNUM | IMGNUM | FIELD | PHOTFLAG | PHOTPROB | FLUXCAL | FLUXCALERR | PSF_SIG1 | ... | SKY_SIG | SKY_SIG_T | RDNOISE | ZEROPT | ZEROPT_ERR | GAIN | XPIX | YPIX | MAG | VALID_MJD | |
|---|---|---|---|---|---|---|---|---|---|---|---|---|---|---|---|---|---|---|---|---|---|
| 34555 | 57623.401 | r | 20 | 566629 | C2 | 1 | 0.0 | 1.050 | 9.193400 | 2.375 | ... | 78.5 | 0.0 | -9.0 | 32.273998 | 0.0 | 1.02 | 1963.099976 | 936.599976 | 27.447027 | True |
| 387172 | 57623.401 | r | 20 | 566629 | C2 | 0 | 0.0 | 26.847 | 8.179171 | 2.375 | ... | 78.5 | 0.0 | -9.0 | 32.275002 | 0.0 | 1.02 | 1940.599976 | 1216.900024 | 23.927761 | True |
| 398185 | 57623.401 | r | 20 | 566629 | C2 | 1 | 0.0 | 3.829 | 8.740541 | 2.375 | ... | 78.5 | 0.0 | -9.0 | 32.275002 | 0.0 | 1.02 | 1267.599976 | 1609.500000 | 26.042287 | True |
3 rows × 22 columns
[19]:
lc = phot.get_lc(myCid)
lc.head()
[19]:
| MJD | BAND | CCDNUM | IMGNUM | FIELD | PHOTFLAG | PHOTPROB | FLUXCAL | FLUXCALERR | PSF_SIG1 | ... | SKY_SIG | SKY_SIG_T | RDNOISE | ZEROPT | ZEROPT_ERR | GAIN | XPIX | YPIX | MAG | VALID_MJD | |
|---|---|---|---|---|---|---|---|---|---|---|---|---|---|---|---|---|---|---|---|---|---|
| 34555 | 57623.401 | r | 20 | 566629 | C2 | 1 | 0.0 | 1.050 | 9.193400 | 2.375 | ... | 78.500000 | 0.0 | -9.0 | 32.273998 | 0.0 | 1.02 | 1963.099976 | 936.599976 | 27.447027 | True |
| 34556 | 57623.403 | i | 20 | 566630 | C2 | 1 | 0.0 | 6.220 | 8.719160 | 2.482 | ... | 97.099998 | 0.0 | -9.0 | 32.546001 | 0.0 | 1.03 | 1960.199951 | 940.000000 | 25.515524 | True |
| 34557 | 57623.408 | z | 20 | 566631 | C2 | 2049 | 0.0 | -11.037 | 8.398740 | 2.284 | ... | 162.399994 | 0.0 | -9.0 | 33.049000 | 0.0 | 1.02 | 1935.000000 | 954.799988 | NaN | True |
| 34558 | 57627.392 | g | 20 | 568227 | C2 | 1 | 0.0 | 1.340 | 9.836040 | 2.515 | ... | 45.400002 | 0.0 | -9.0 | 31.580999 | 0.0 | 1.07 | 1965.199951 | 951.900024 | 27.182238 | True |
| 34559 | 57627.394 | r | 20 | 568228 | C2 | 1 | 0.0 | -11.648 | 14.469305 | 2.551 | ... | 63.099998 | 0.0 | -9.0 | 31.596001 | 0.0 | 1.02 | 1952.300049 | 949.200012 | NaN | True |
5 rows × 22 columns
[20]:
lc.columns
[20]:
Index(['MJD', 'BAND', 'CCDNUM', 'IMGNUM', 'FIELD', 'PHOTFLAG', 'PHOTPROB',
       'FLUXCAL', 'FLUXCALERR', 'PSF_SIG1', 'PSF_SIG2', 'PSF_RATIO', 'SKY_SIG',
       'SKY_SIG_T', 'RDNOISE', 'ZEROPT', 'ZEROPT_ERR', 'GAIN', 'XPIX', 'YPIX',
       'MAG', 'VALID_MJD'],
      dtype='object')
We obtain another DataFrame with the time-series data loaded in for our CID.
We can also use the get_lcs for multiple events, providing a list of CIDs in that case.
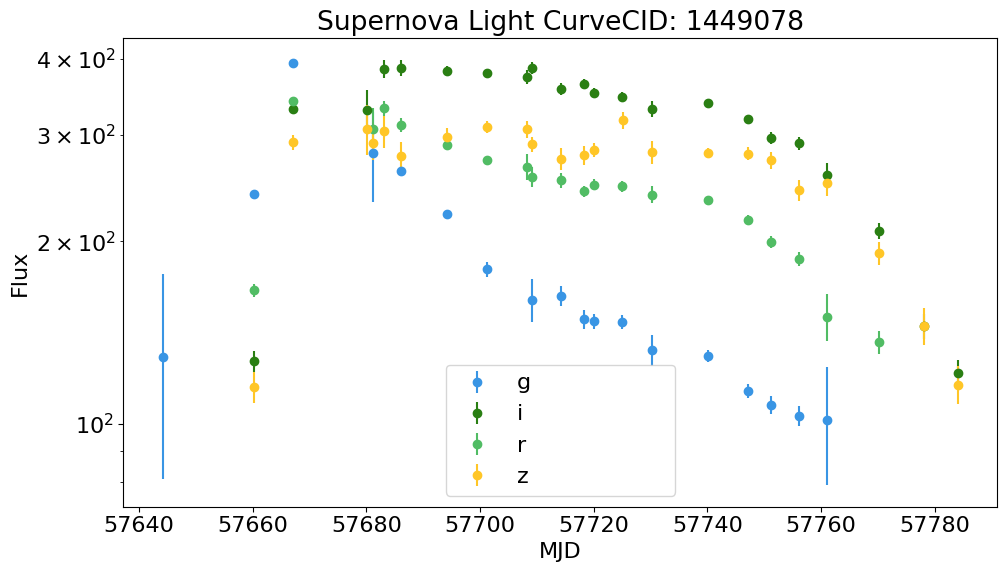
Let’s try to visualize this light-curve using the plot module from dessndr
[21]:
from dessndr import plot
[22]:
fig, ax = plot.plot_sn_light_curve(lc[lc.FLUXCAL>100], CID=myCid, figsize=(10, 6))
ax.set_yscale('log')
Load low redshift samples:
[23]:
lowz_phot_version = os.path.join(
    data.DES5YRDR_DATA_ROOT,
    'DES-SN5YR/0_DATA/DES-SN5YR_LOWZ/DES-SN5YR_LOWZ'
)
lowz = utils.PhotFITS(lowz_phot_version)
[24]:
foundation_phot_version = os.path.join(
    data.DES5YRDR_DATA_ROOT,
    'DES-SN5YR/0_DATA/DES-SN5YR_Foundation/DES-SN5YR_Foundation'
)
foundation = utils.PhotFITS(foundation_phot_version)
[25]:
print(f"""Supernovae in Low-z photometry: {len(lowz.head_df.SNID.unique())},
  and in Foundation photometry: {len(foundation.head_df.SNID.unique())}""")
Supernovae in Low-z photometry: 342,
  and in Foundation photometry: 185
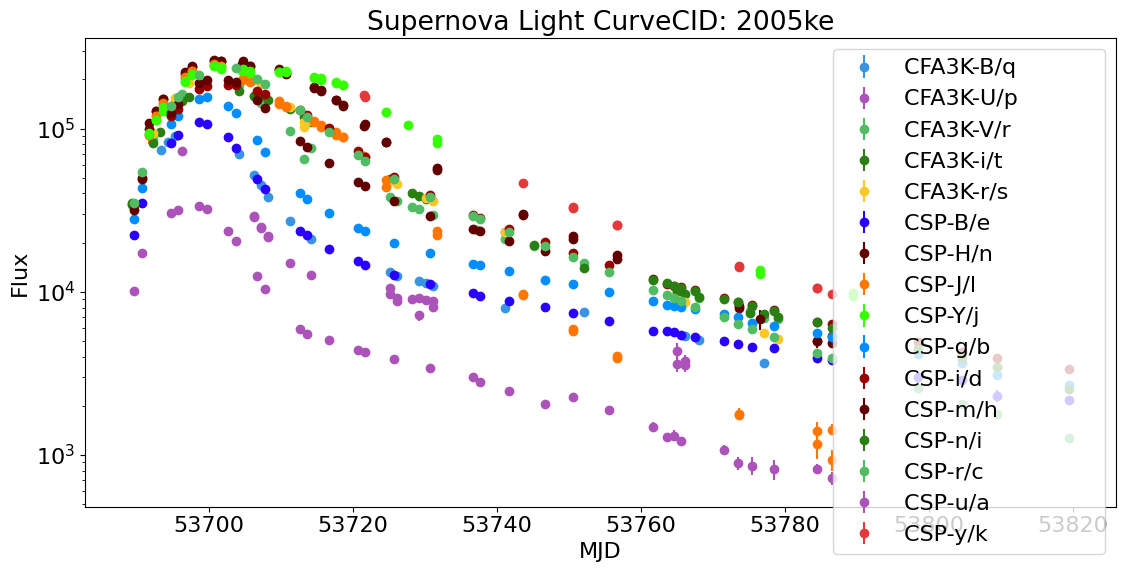
[26]:
random_cid_lowz = lowz.head_df.SNID[10]
fig, ax = plot.plot_sn_light_curve(lowz.get_lc(random_cid_lowz), CID=random_cid_lowz, figsize=(12, 6))
ax.set_yscale('log')
[27]:
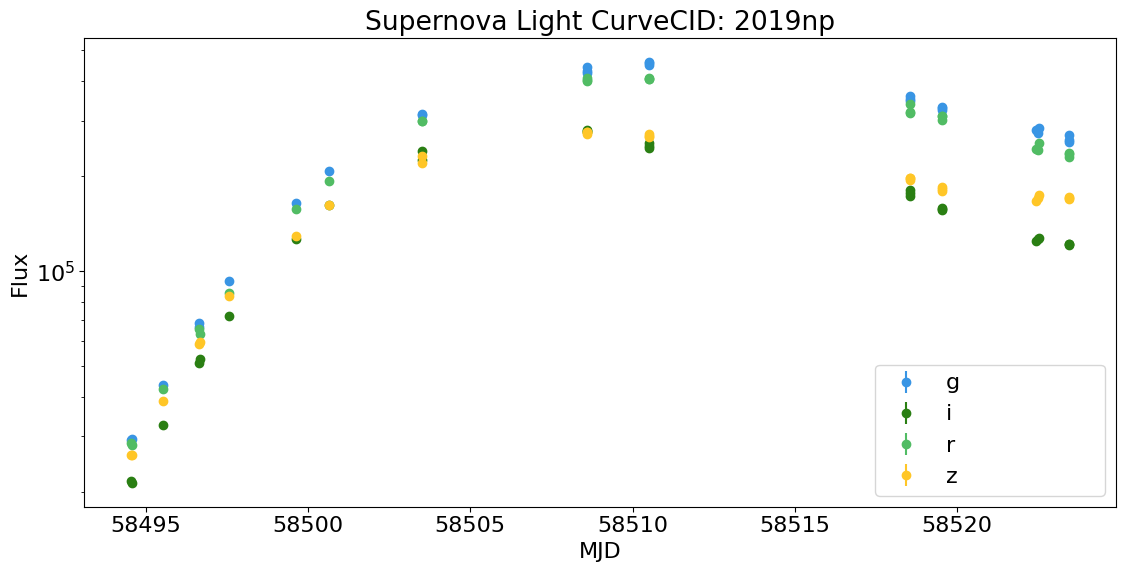
random_cid_found = foundation.head_df.SNID[184]
lc = foundation.get_lc(random_cid_found)
lc = lc[lc.FLUXCAL > 200]
fig, ax = plot.plot_sn_light_curve(lc, CID=random_cid_found, figsize=(12, 6))
ax.set_yscale('log')
[ ]:
